Page 175 - CBSE Annual Report 2013-14
P. 175
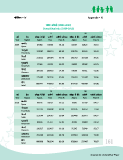
ifjf'k"V – IV Appendix – IV lexz vkadMs+ (2009-2013) Overall Statstcs (2009-2013) X XII o"kZ {ks= ijh{kk esa cSBs mÙkh.kZ mÙkh.kZ izfr'kr ijh{kk esa cSBs mÙkh.kZ mÙkh.kZ izfr'kr Year Region Appd. Pass Pass % Appd. Pass Pass % vtesj 2009 87088 81984 94.14 69507 60425 86.93 Ajmer iapdqyk 117087 104153 88.95 101756 82630 81.20 Panchkula fnYyh 232621 204004 87.70 181792 153166 84.25 Delhi xqokgkVh 37966 22939 60.42 28695 18368 64.01 Guwahat psUubZ 105353 100716 95.60 54000 49711 92.06 Chennai bykgkckn 225309 201733 89.54 176353 131482 74.56 Allahabad ;ksx 805421 715529 88.83 612103 495782 81.00 Total X XII o"kZ {ks= ijh{kk esa cSBs mÙkh.kZ mÙkh.kZ izfr'kr ijh{kk esa cSBs mÙkh.kZ mÙkh.kZ izfr'kr Year Region Appd. Pass Pass % Appd. Pass Pass % vtesj 2010 98186 91815 93.51 78885 66789 84.67 Ajmer iapdqyk 127715 113848 89.14 111146 86353 77.69 Panchkula fnYyh 251644 224065 89.04 199448 169477 84.97 Delhi xqokgkVh 40306 25767 63.93 30193 20984 69.50 Guwahat psUubZ 116927 112465 96.18 56245 51840 92.17 Chennai bykgkckn 251560 223344 88.78 197001 142024 72.09 Allahabad ;ksx 886338 791304 89.28 672918 537467 79.87 161 Total Created by: India Offset Press